How the Standalone Hub Architecture Cuts Charging Site CAPEX by 32%

When a Charge Point Operator plans an 8-plug DC fast-charging site, the choice of hardware architecture has a bigger impact on total investment than most operators expect. In this case study, we compare a conventional standalone charger deployment against WILLBERT's S-HUB configuration and show where €121,000 in savings actually come from.
Three Generations of Charging Architecture
Before diving into the numbers, it helps to understand how EV charging site design has evolved. The industry has moved through three distinct architectural generations, each solving problems the previous one created, while introducing trade-offs of its own.

The Standalone Hub eliminates the core weakness of each predecessor. Unlike standalone chargers, it enables dynamic power allocation across multiple plugs. Unlike distributed systems, it does so without dedicated power cabinets, long DC cable runs, or the maintenance overhead of a complex high-voltage DC bus.
The Site: 8 Plugs at a Retail Location
Our comparison looks at a real-world scenario: an 8-plug DC fast-charging site at a retail park. Both configurations deliver 8 CCS charging points, each capable of at least 240 kW at 400 V and up to 480 kW at 800 V vehicle architectures. The CAPEX estimate covers hardware and cabling and it intentionally excludes shared infrastructure (transformer substation, trenching) since those are identical in both scenarios.
Option A: Typical Standalone (4 × 400 kW all-in-one chargers)
Four standalone chargers, each rated at 400 kW, each operating independently. Power is dynamically shared across 2 CCS outputs per unit, but cannot flow between chargers. Total installed power: 1.6 MW — significantly more grid capacity than typically needed, since each charger must be sized for peak demand independently.

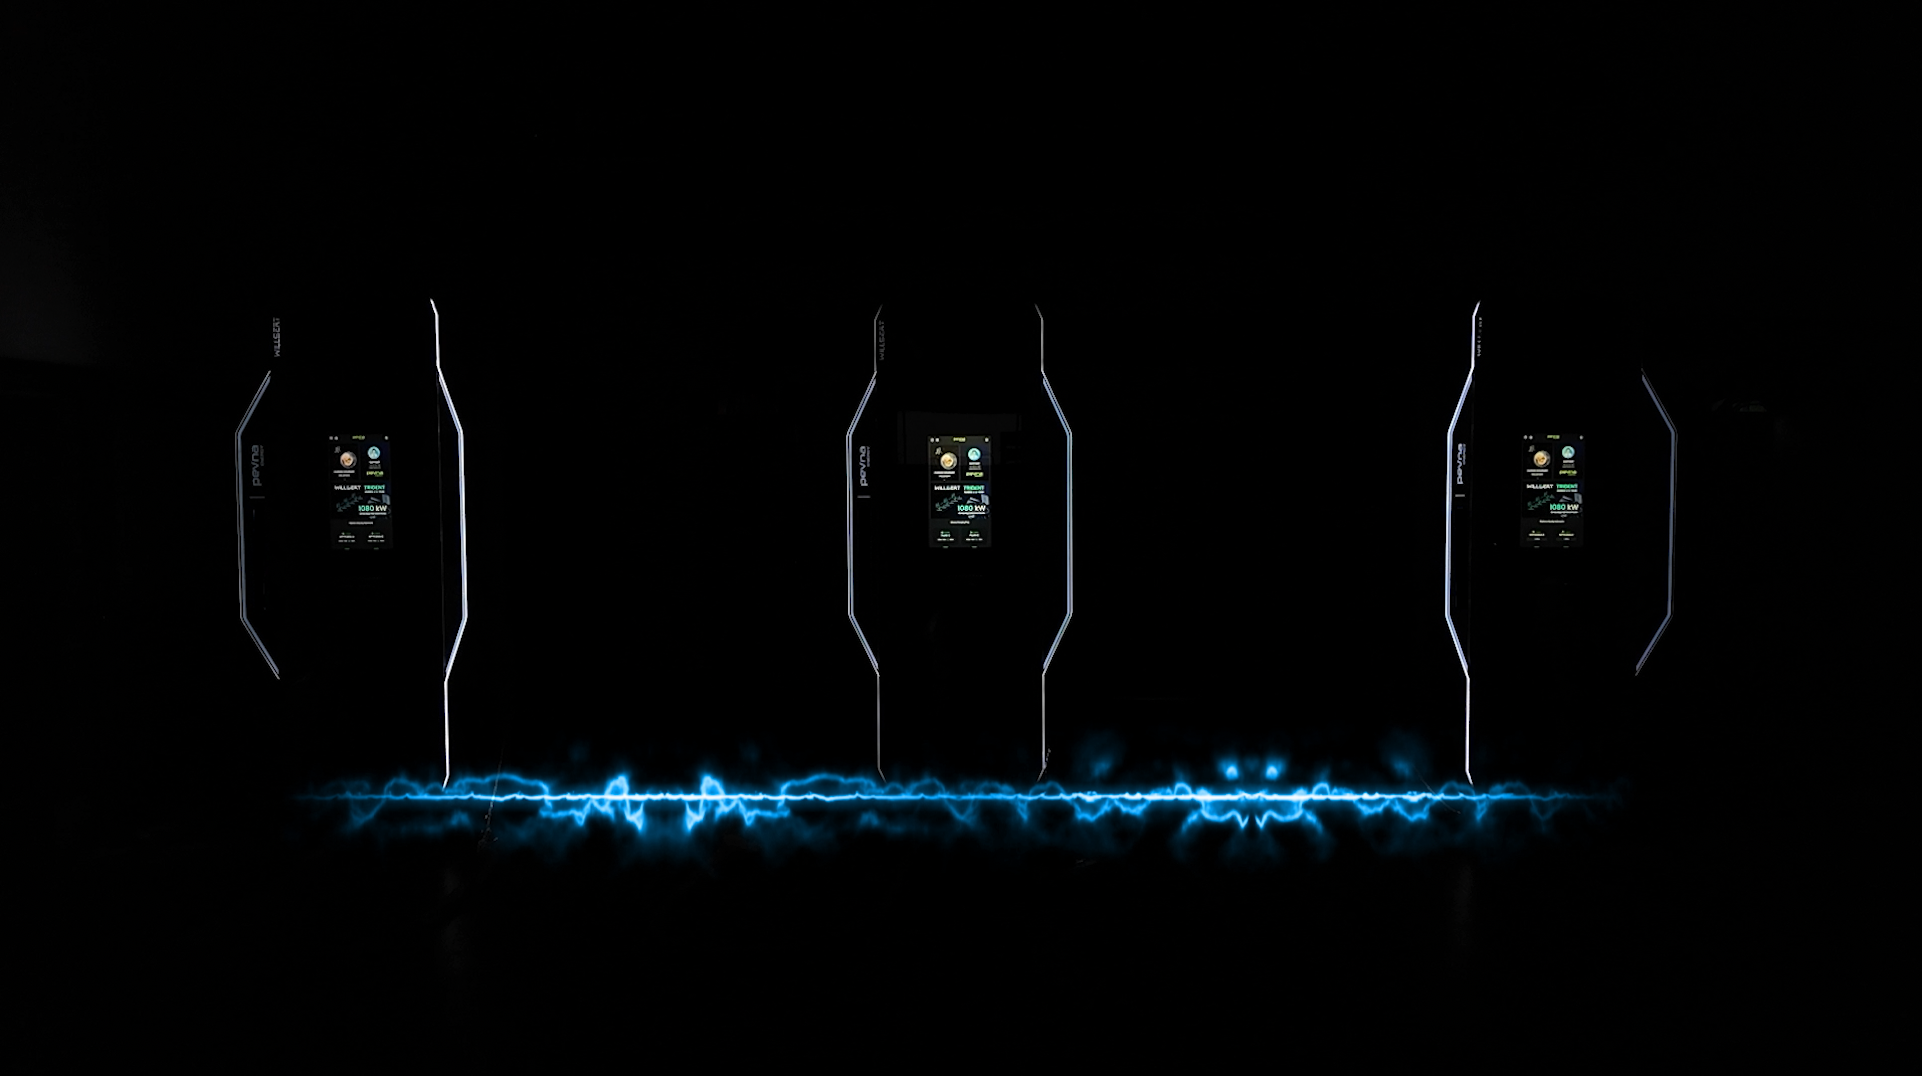
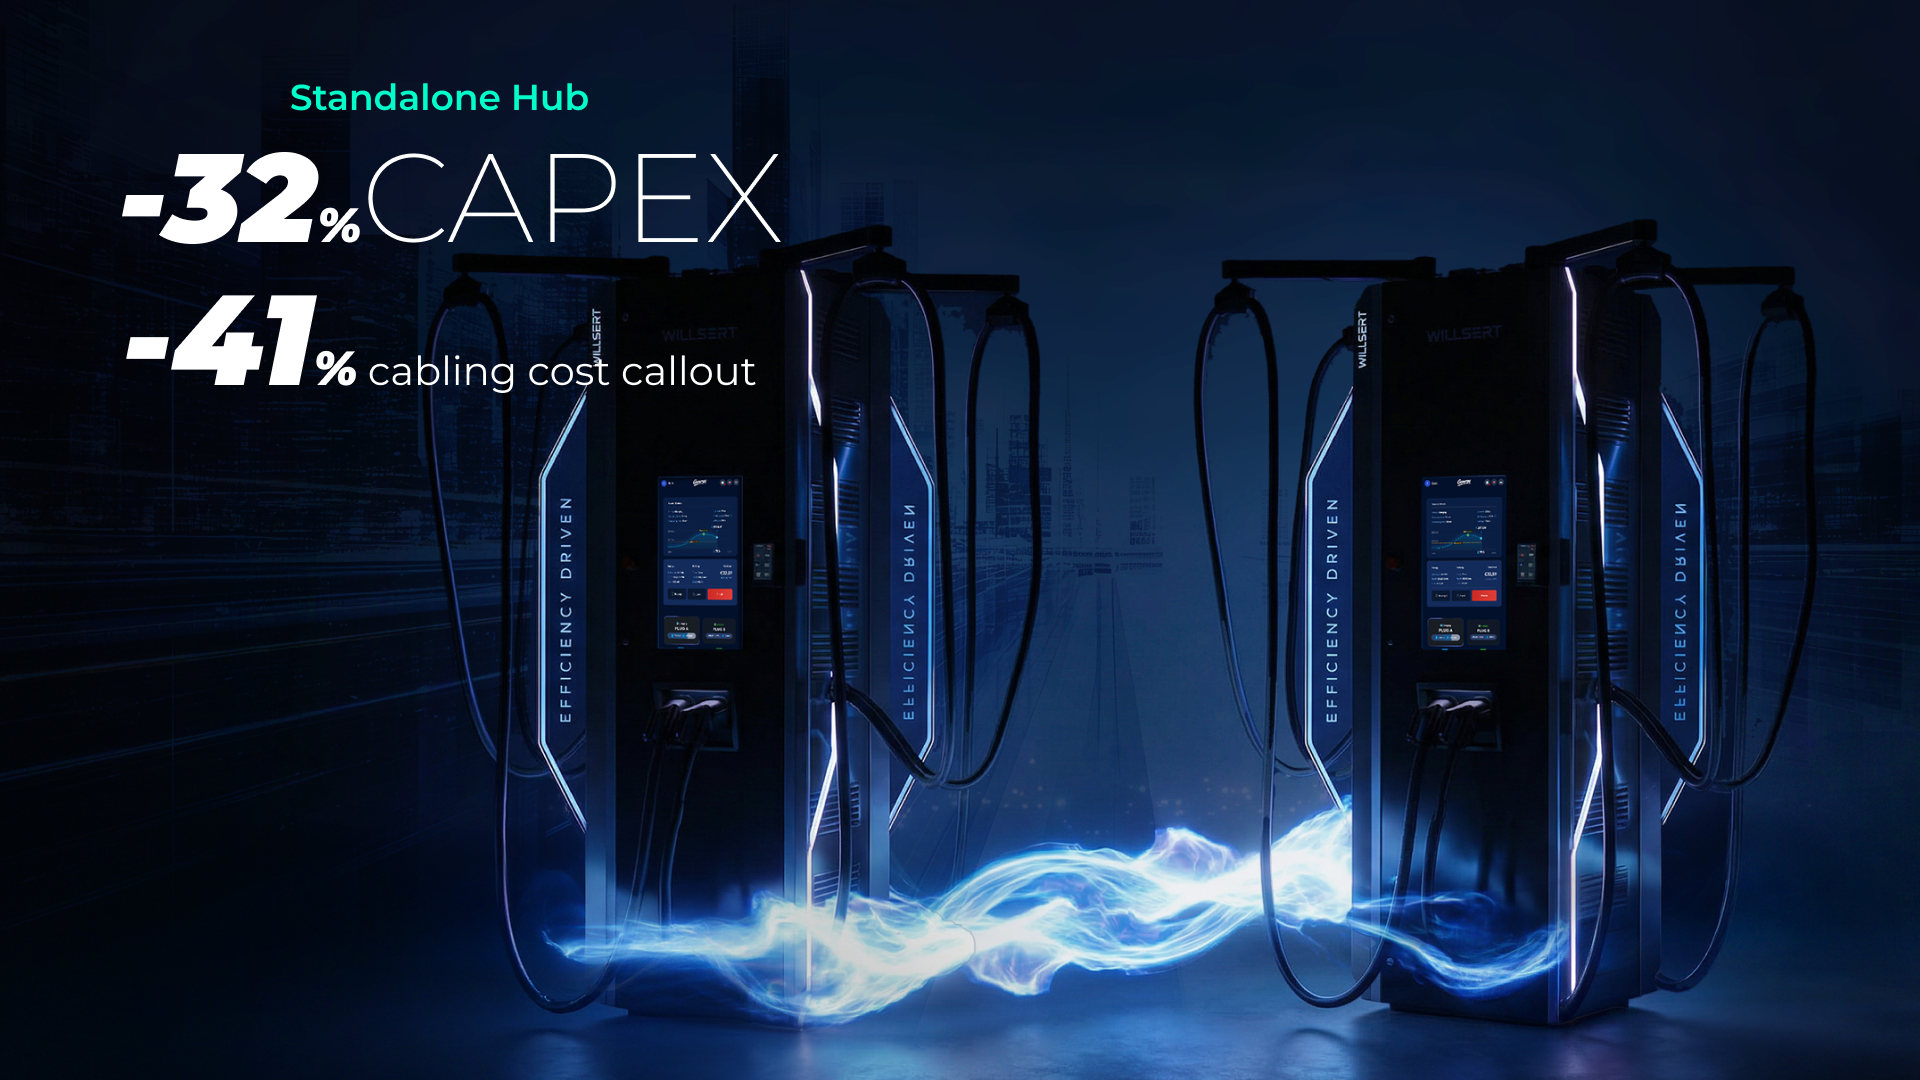
Option B: S-HUB (4 × WILLBERT Amber II 1F, paired into 2 S-HUB systems)
Four Amber II chargers, each with 4 power modules, paired into 2 S-HUB systems. Each S-HUB delivers 480 kW dynamically across 4 CCS outputs. Total installed power: 0.96 MW - 40% less grid connection than the standalone option, while delivering equal or higher per-plug peak power. Each S-HUB can also be upgraded to 720 kW.


€121,000 saved The S-HUB configuration reduces total site CAPEX by 32%, with cabling costs alone dropping 41% (€18,000 less) thanks to the simplified architecture and lower installed power requirement.
What Makes the Difference?
The savings come from two reinforcing effects. First, less installed power. Because the S-HUB dynamically allocates power where it's needed, the site requires 0.96 MW instead of 1.6 MW - a 40% reduction in grid connection and power electronics. In practice, most vehicles on a site are never all charging at peak simultaneously, so the standalone approach massively over-provisions capacity that sits idle most of the time.
Second, simpler cabling. With paired S-HUB chargers sharing power via a short DC link, the total cable runs from transformer to charging points are shorter and require fewer independent high-power feeds. That translates directly into less copper, fewer cable trenches, and a faster installation timeline.
Beyond Cost: The Upgrade Advantage

Perhaps the most underrated advantage is future-proofing. The standalone configuration is locked at 400 kW per charger with no upgrade path. The S-HUB can be upgraded to 720 kW per system, meaning as vehicle battery sizes grow and charging curves steepen, the same hardware can keep pace without a forklift replacement.
The Bottom Line
For operators deploying 8-plug sites at retail locations, switching from standalone chargers to WILLBERT's S-HUB architecture delivers a compelling set of improvements: 32% lower CAPEX, 40% less grid capacity required, higher per-plug peak power, better power utilisation, and a built-in upgrade path to 720 kW. All is achievable with a simpler installation.
The maths are straightforward. The same number of plugs, better performance for drivers, and €121,000 back in the operator's pocket per site. At scale across a portfolio of 10, 20, or 50 sites, that's the difference between a marginal business case and a comfortable one.
Piotr Krzemiński leads marketing and business strategy at WILLBERT, shaping its retail-focused EV charging solutions. With a background in management, he brings deep expertise from top marketing agencies to drive brand growth and market positioning.